Visual Journey Canvas#
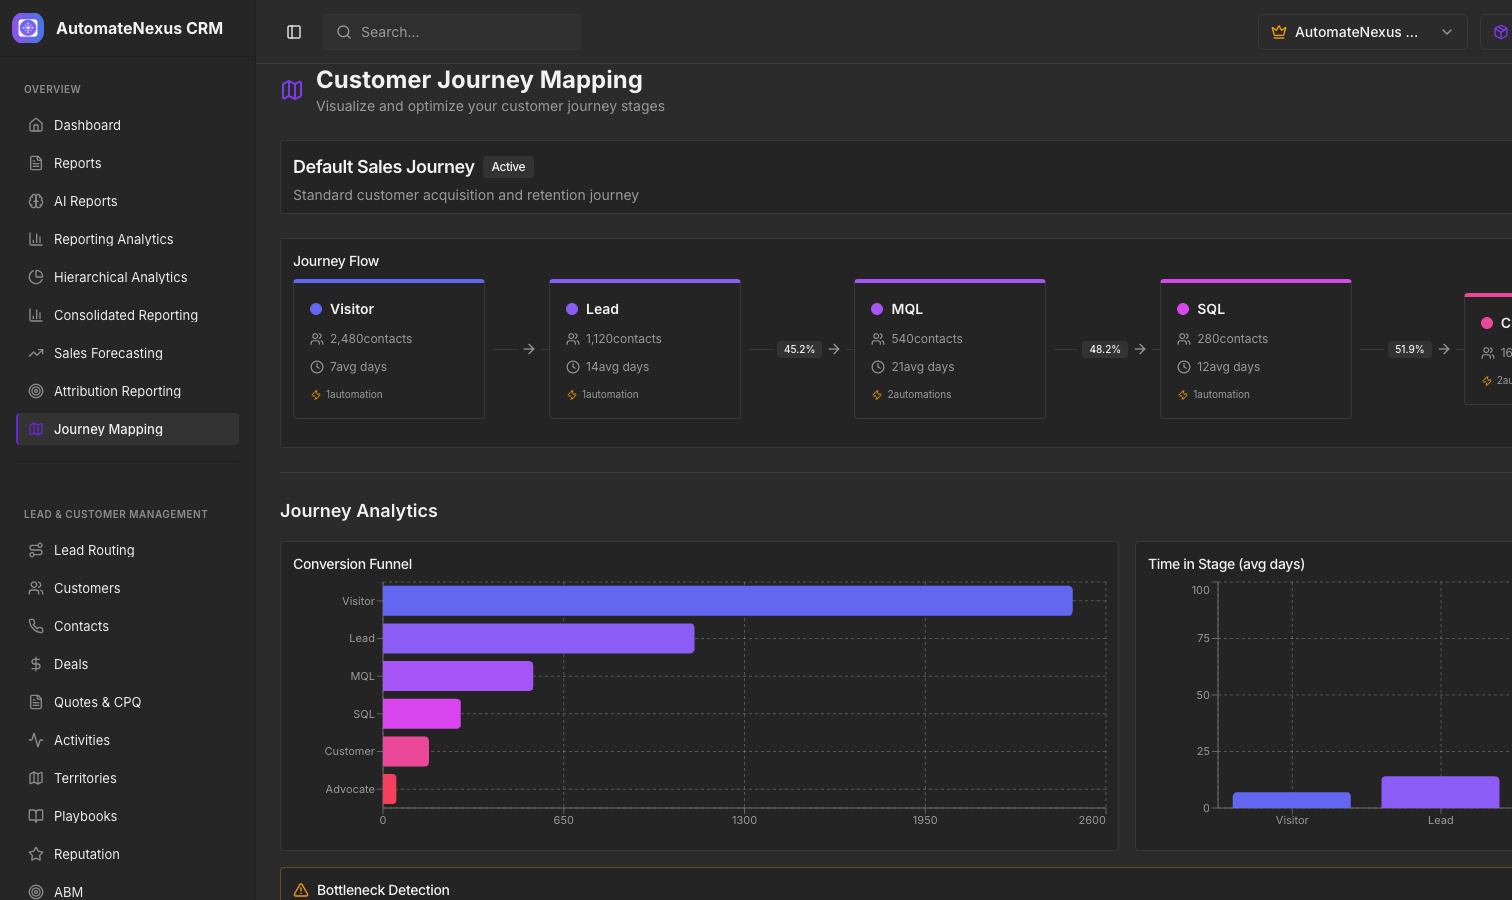
Customer Journey Mapping, under Insights → Journey Mapping, shows the stages a prospect moves through on their way to becoming a customer as a row of stage cards joined by arrows. A journey map starts empty: click New journey to create one, then click Add stage for each stage and name it to suit your process. A typical journey might run:
- Visitor — Anonymous website visitor
- Lead — Identified prospect who has shown interest
- MQL (Marketing Qualified Lead) — Lead that meets marketing qualification criteria
- SQL (Sales Qualified Lead) — Lead accepted by sales as a genuine opportunity
- Customer — Closed-won deal, active customer
- Advocate — Happy customer who refers others
Use the drop-down in the page header to switch between your journey maps, and its ⋯ menu to Delete journey.
Stage Configuration#
Select a stage card to open Edit stage, where you can set:
- Name and color — the stage's name and one of twelve colors
- Automations — a list of the automations you plan for the stage, each of one type: Email sequence, Create task, Add tag, Notification or Webhook. These entries are recorded on the stage as a plan; they do not run on their own. To run something automatically when a record changes stage, build a workflow under Projects → Workflows with a Deal Stage Changed or Record Updated trigger.
Save changes keeps your edits and Delete stage removes the stage. Each stage card also shows the number of contacts in the stage, the average number of days spent there when that has been recorded, and how many automations are listed on it.
Conversion Metrics#
Between each pair of stages, the arrow shows the conversion rate from the previous stage — the stage's contact count as a percentage of the stage before it. This makes it easy to identify where prospects get stuck or drop off.
Journey Analytics#
Below the stage cards, two charts and a card summarize the journey:
- Contacts by stage — Horizontal bar chart of how many contacts sit in each stage
- Time in stage — Bar chart of the average days before a contact moves on
- Bottlenecks — Lists the stages that hold contacts longest (more than one and a half times the average time) or lose the most of them (fewer than 40% carry through from the stage before)
Both charts show an empty state until contacts have been assigned to stages and have moved between them.
Automation Triggers#
The Automations list on each stage documents the handoffs you intend at each transition — sending emails, creating tasks, updating deal stages and notifying team members. The handoffs themselves are automated in the workflow builder, where a Deal Stage Changed trigger can send an email, create a task, update a record or notify your team through a webhook.