What is Attribution?#
Multi-touch attribution tracks the touchpoints a prospect has with your brand before converting, then credits the revenue of each closed-won deal to the channels and campaigns that influenced it. Open it under Insights → Attribution Reporting.
Attribution Models#
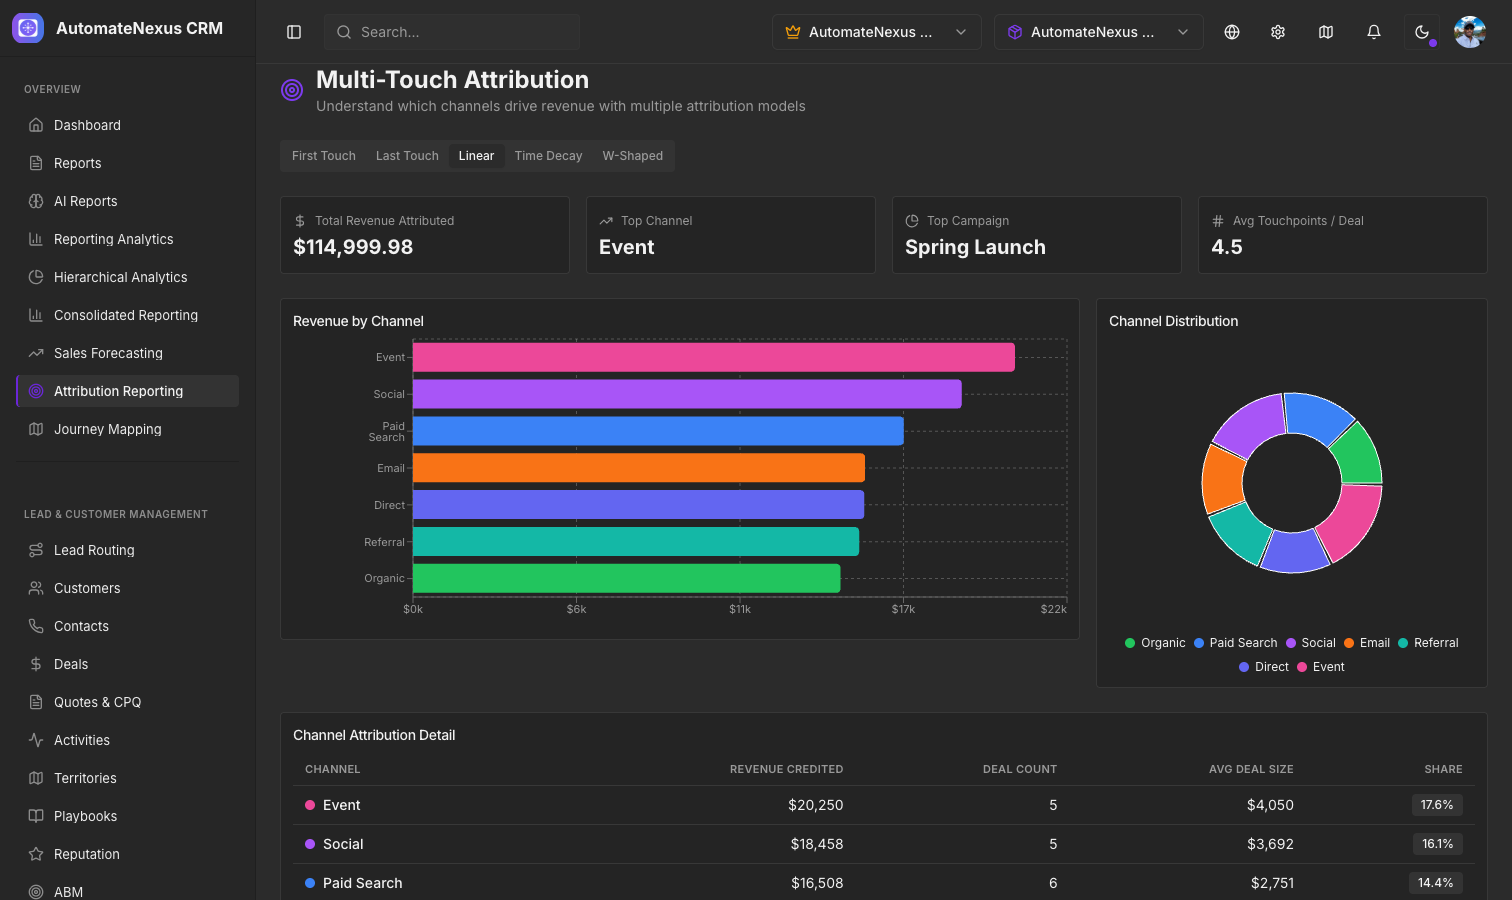
AutomateNexus CRM supports five attribution models, chosen from the drop-down in the page header; a one-line description of the selected model appears under the page title:
- First touch — 100% credit to the first interaction that brought the prospect in
- Last touch — 100% credit to the final interaction before conversion
- Linear — Equal credit distributed across all touchpoints (the default)
- Time decay — More credit to recent touchpoints, using a 7-day half-life exponential decay
- W-shaped — 30% to the first touch, 30% to the touchpoint nearest the midpoint between the first touch and the deal's creation, 30% to the touchpoint nearest the deal's creation, and 10% distributed among the remaining touchpoints
Revenue is credited only for closed-won deals that have linked touchpoints; open pipeline is not counted as revenue.
Tracked Touchpoints#
Touchpoints are recorded automatically when contacts arrive through tracked forms and sites and when they open or click tracked emails:
- Form submissions on your forms and website pages, classified from the link's UTM source and medium and the referring site
- Email opens and clicks (the first open and the first click of each tracked email)
Each touchpoint is filed under one of seven channels — Organic, Paid Search, Social, Email, Referral, Direct or Event — and keeps its source, medium, campaign and page URL. A touchpoint links to a deal when the deal is created for a tracked contact.
Revenue by Channel#
The Revenue by channel chart shows attributed revenue per channel under the selected model, making it easy to identify which channels drive the most value. The Channels table beneath it lists each channel's revenue credited, number of deals, average deal size and share of credited revenue. Four figures at the top of the page summarize the report: Revenue attributed, Top channel, Top campaign (the campaign with the most touchpoints) and Touchpoints per deal.
Deal-Level Analysis#
The Deal journeys list shows every deal with linked touchpoints, newest first, with its stage, value and number of touchpoints. Expand a deal to see its complete touchpoint timeline — every interaction from first touch to last touch, with the channel, date and time, campaign, source and page URL.
Using Attribution Data#
Use attribution insights to optimize your marketing spend by investing more in the channels credited with the most revenue and reducing spend on underperforming ones. Tag the links in your campaigns with UTM parameters so each touchpoint carries the right source, medium and campaign. If no touchpoints have been recorded yet, choose View sample data from the ⋯ menu in the page header to see what the report looks like with example figures.