The report builder in AutomateNexus CRM lets you make your own reports from your CRM records: pick what to report on, filter it, choose the dates, and show it as a table, a chart or a single number, with a live preview of your real data as you go. Saved reports can be run again at any time, downloaded as a CSV file and emailed on a schedule. Dashboards put several of these figures on one screen, a grid of numbers, charts, lists and leaderboards you check every day or show on the office TV. Both are for anyone on your team; what each person sees follows the records and fields their role lets them read. Your first report takes about five minutes, and a dashboard from a template takes about two.
Before You Start#
- Where to find it: reports are under Insights → Reports, on the Custom tab. Dashboards are under Insights → Advanced Dashboards.
- Records: a report only shows records you already have in the CRM, such as deals, contacts or invoices. An empty CRM gives empty reports, never sample figures.
- Exports: downloading a CSV file takes the Export permission. Owners and Admins have it; for anyone else, an Owner or Admin switches it on for their role under Administration → Access → Roles and permissions.
- Workspace: a report counts the records of the workspace you are in, so the same report can show different figures in another workspace.
Open the Report Builder#
- In the sidebar, open Insights → Reports.
- Click the Custom tab. It has three tabs of its own: My reports, Templates and Scheduled.
- Click New report. The Report Builder opens, with your settings on the left and the Live Preview on the right.
The date picker at the top of the Reports page does not apply on the Custom tab. Each saved report keeps its own dates.
Build a Report#
Work down the left side. The preview updates half a second after each change and shows how many records match.
1. Choose the Data Source#
Under Data Source, pick what the report is about: Deals, Contacts, Customers, Companies, Activities, Tasks, Invoices, Sales, Orders, Quotes, Projects, Project tasks or Support Tickets. Changing the source clears the columns, filters and grouping you picked, because each source has its own fields.
2. Pick the Columns#
Under Columns, choose the fields to show in the table, for example Deal, Stage, Value and Expected Close for deals. The first six fields of the source are picked for you to start with. Fields your role hides are not offered.
3. Add Filters#
- Click Add filter.
- Pick the field, then how to compare it. Text fields offer contains, does not contain, equals and does not equal. Number and money fields offer equals, does not equal, > and <. Status and choice fields offer is and is not. Date fields offer before, after, equals, is today, is this week, in last 7 days and in last 30 days. Most fields also offer is empty and is not empty.
- Enter or pick the value. Status fields give you a list to choose from, such as Closed Won for a deal's stage.
- With two or more filters, an AND / OR switch appears. AND keeps records that match every filter; OR keeps records that match any of them.
Click the X at the end of a filter to remove it.
4. Set the Date Range#
Under Date Range, choose Last 7 days, Last 30 days, Last 90 days, This month, Last month, This year or All time. A new report starts on Last 30 days. In the box beside it, choose which date the range is measured on, for example a deal's Created, Closed At or Expected Close date. The range is counted again each time the report runs, so "This month" always means the current month.
5. Group and Add Up (for Charts and Numbers)#
- Group By decides what each bar, point or slice stands for. Pick a field such as Stage or Lead Source to get one bar or slice per value. Pick a date field and then By day, By week or By month to show the figure over time. Auto (date) uses the report's date, grouped by day, week or month, whichever you pick next to it.
- Aggregate decides the figure: Count counts the records, Sum adds up a number field and Average averages it. For Sum and Average, choose the field, such as Value or Total. Amounts in another currency are converted into your workspace's currency before they are added up.
6. Choose the Visualization#
Under Visualization, pick one:
- Table: the records themselves, with your chosen columns.
- Bar chart: one bar per group. Groups by a field are sorted largest first; groups by date run in date order.
- Line chart: the figure as a line, best for grouping by date.
- Pie chart: how a total splits into groups. With more than eight groups, the smallest are added together as Other.
- Stat: one number, such as the total value of deals won this month.
7. Name and Save#
- Type a Report Name, for example "Won deals by month". It is required.
- Add a Description if you like, so others know what the report shows.
- Click Create Report. The report appears under My reports.
The preview reads up to 500 records to stay quick. A saved report reads up to the 5,000 most recent records for its date.
Run, Edit and Export a Report#
The My reports list shows each report's name, Type (Custom for reports you built), when it was Last run and when it was Created.
- Run it: click the report's name or the play button. The report opens with its chart or number, the number of records and the date range. Under a chart or number, Underlying rows lists the records it was counted from. A table shows the first 100 rows on screen; the CSV file holds them all.
- Refresh it: while it is open, choose Refresh from the three-dot menu.
- Change it: click Edit on the open report, or choose Edit report from the three-dot menu in the list. The builder opens filled in; click Save Changes.
- Download it: click Export CSV on the open report, or the download button in the list. The file holds every matching record with the report's columns, minus any your role hides.
- Delete it: choose Delete from the three-dot menu and confirm with Delete Report. This cannot be undone.
Click the back arrow to return to the list.
Start From a Template#
The Templates tab has four ready-made reports, each showing the figures it works out by month:
- Sales & revenue: revenue, transactions, average order value and win rate.
- Customer analytics: customer acquisition and revenue per customer.
- Financial performance: revenue, expenses and profit margin.
- Operational metrics: efficiency, tasks completed and on-time rate.
Click Use template to add one to My reports. When you open it, it shows its key figures, a trend chart, a comparison chart and a data table. Its Export tab downloads the figures as PDF, Excel or CSV: choose the format and click Download. Template reports can't be changed in the builder; build a new report when you need different fields.
With no reports yet, the empty My reports tab also offers Add sample reports, which adds four of these ready-made reports at once.
Email a Report on a Schedule#
- On the Custom tab, open Scheduled and click Schedule report. Schedule at the top of the Reports page takes you to the same place.
- Under Select Report, choose the report.
- Choose the Frequency: Daily, Weekly or Monthly. Monthly emails go out on the 1st of the month.
- Pick the Time, a whole hour on your own clock: the form shows your time zone, and the email goes out within that hour.
- For weekly emails, tick the Days of Week.
- Under Recipients, enter email addresses separated by commas. Leave it blank to email the person who made the report.
- Click Schedule Report.
The email names the report and has an Open report button that opens that report. The figures themselves are not in the email, so recipients need to sign in to the CRM to see them.
The Scheduled tab lists each scheduled report with its schedule, how many recipients it has and when it was last sent. To change one, choose Edit schedule from the three-dot menu and click Update Schedule. To stop the emails, switch off Enabled. A scheduled report stays in My reports too, marked Scheduled, where you can open, edit and export it as usual.
Share a Report Link#
- In My reports, choose Share from the report's three-dot menu.
- Choose when the link stops working under Expires: Never, 1 day, 7 days or 30 days. You can change it later; a change applies to the link straight away.
- Switch on Public Access. A Share Link appears; click the copy button next to it.
- To turn the link off, switch Public Access off again. The old link stops working.
Anyone with the link sees the report and its figures as they were when you shared it, signed in or not. The figures are the ones you yourself may see: fields your role hides are left out, and a table shows its first 100 rows. To refresh what the link shows, open Share again and choose Update figures; the dialog says when they were last saved.
You don't need to share a report with your own team: everyone in your organization already sees the reports under My reports.
Build a Dashboard#
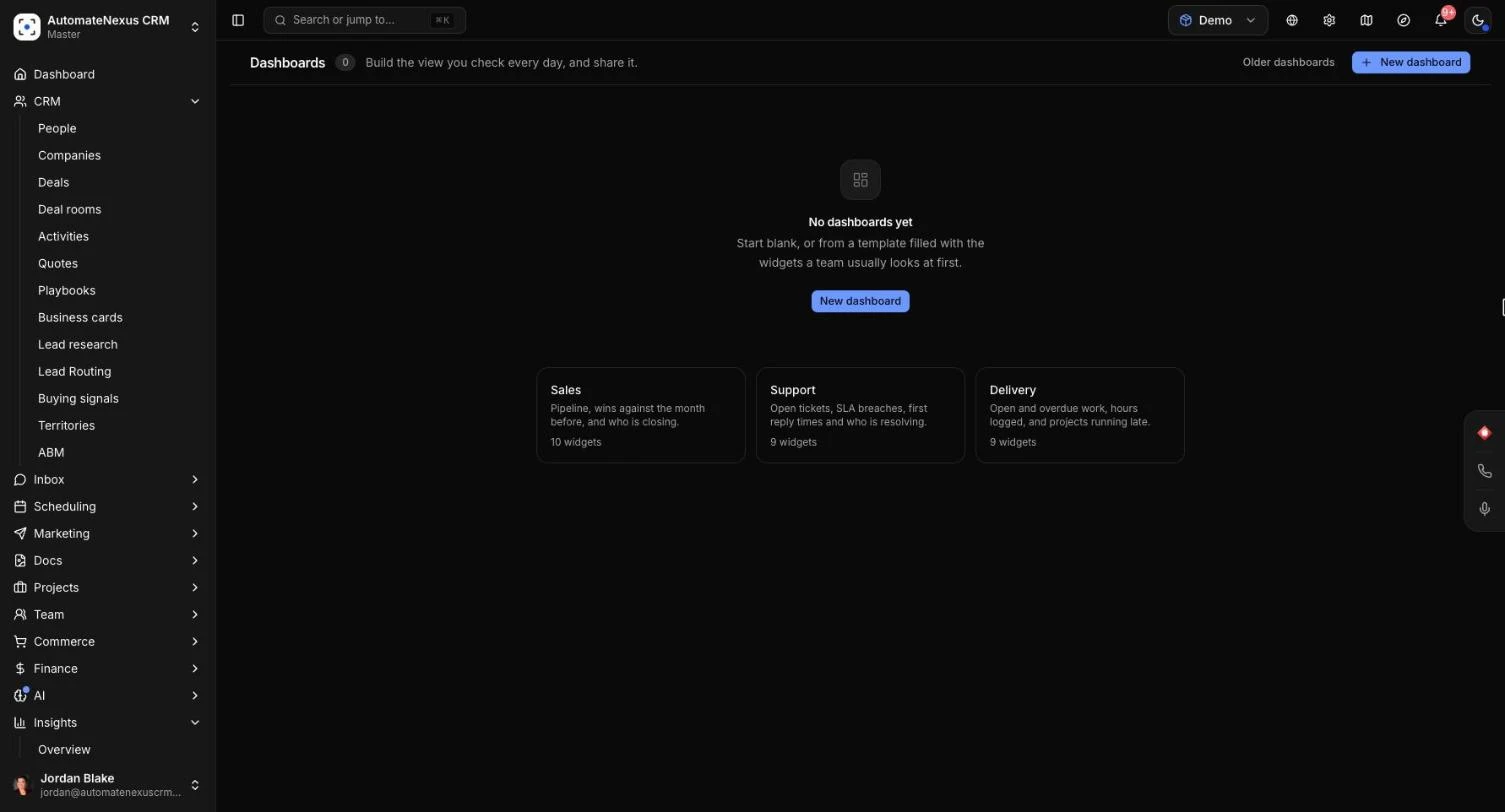
- Open Insights → Advanced Dashboards and click New dashboard.
- Type a Name, for example "Monday pipeline review", and a Description if you like.
- Under Start from, choose Blank for an empty grid, or a template:
- Sales: pipeline, wins against the month before, and who is closing.
- Support: open tickets, SLA breaches, first reply times and who is resolving.
- Delivery: open and overdue work, hours logged, and projects running late.
- Under Who sees it, choose Only me (nobody else sees it, admins included), A workspace (everyone who can open that workspace; pick it from the list) or The whole team (everyone on your organization's team, never portal clients).
- Under Refresh while open, choose Off or how often the figures update, from Every minute to Every hour.
- Click Create dashboard. The dashboard opens.
Sharing a dashboard shares its layout. Each person sees the figures of the records they themselves may read.
Add and Arrange Widgets#
- On the dashboard, click Edit, then Add widget.
- Under Count, choose what to count: Deals, People, Companies, Tasks, Projects, Tickets, Invoices, Activities or Time entries.
- Pick how to show it:
- Number: one figure, with the period before beside it.
- Bar chart: compare groups side by side, or a figure over time.
- Line chart and Area chart: a figure over time.
- Donut chart: how a total splits into groups.
- List: the records themselves, latest first.
- Leaderboard: people ranked by a figure.
- Goal: progress towards a target.
- The widget is added with a sensible first setting and real figures, and Widget settings opens so you can change it (see below). Click Apply.
- Drag the handle at the top of a widget to move it, and the handle in its bottom-right corner to resize it. You can also select a handle and use the arrow keys.
- From a widget's three-dot menu, choose Edit widget, Duplicate or Remove.
- Click Save to keep your changes, or Cancel to drop them. Unsaved changes shows next to the name until you save.
On a phone, widgets are stacked one above the other and can't be arranged; open the dashboard on a larger screen to edit it.
Widget Settings#
- Title: leave it blank and the widget names itself from its settings, such as "Value of deals by stage".
- Show as and Data: change the kind of widget or what it counts.
- Measure and Add up as: count the records (Number of deals), or add up a figure such as Value, Hours or First response time as a Total or an Average. Figures like probability or reply time can only be averaged.
- Split by (bar and donut charts) or Rank (leaderboards): the field that makes the groups, such as Stage or Owner. A bar chart can also show Over time.
- Each point is a: for charts over time, Day, Week, Month or Quarter, or Chosen for the range.
- Dates: The dashboard's range, or a range of the widget's own, such as This year on a dashboard showing the last 30 days. Counted by picks which date is used, such as a deal's Closed date.
- Only ... that are: tick conditions such as Open, Won or Overdue.
- Filters: click Add a filter, pick a field, then tick the values to keep, or type values separated by commas.
- Columns, Sort by and Order (lists): choose up to 12 columns and sort Newest or largest first or Oldest or smallest first.
- Rows or How many: up to 100 rows for a list, up to 50 bars or names for a chart or leaderboard.
- Compare with the period before (numbers): shows whether the figure went up or down, in green when that is good news and red when it is not. For overdue work or reply times, going down is good news.
- Target (goals): the figure to reach. The widget shows how far along you are, how much is left, and Target reached when you get there.
If something is missing, the settings say what in plain words, such as "Pick what to split by." or "Set a target above zero.", and Apply waits until it is fixed.
Use a Dashboard#
- Filters for every widget: above the widgets, choose the date range (from Today to All time, or Custom range with a from and to date), the workspace (This workspace, All my workspaces or one by name) and whose records (Everyone's or one person's). Click Keep these filters to make them open with the dashboard, or Reset to go back.
- Refresh: the refresh button at the top updates every widget; Refresh in a widget's three-dot menu updates that one.
- Download a widget: choose Export CSV from the widget's three-dot menu.
- Full screen: the full-screen button fills the screen with larger figures and a clock, for a TV in the office. With Refresh while open set to Off, it updates every 5 minutes anyway. Click Exit full screen or press Escape to leave.
- Make a private copy: the copy button at the top, or Make a private copy in the dashboards list, makes a copy only you see, named with "(copy)", which you can change freely.
- Settings: the settings button opens Dashboard settings to rename it, change who sees it or change how often it refreshes.
- Delete: in the dashboards list, choose Delete from the dashboard's three-dot menu and confirm. A shared dashboard disappears for everyone; the records it counts are not touched.
You can change a dashboard you made. An Owner or Admin can also change or delete a dashboard shared with a workspace or the whole team. Only the person who made a dashboard changes who it is shared with.
Tips#
Troubleshooting#
"No rows match this configuration yet."#
No records match your filters and dates. As the preview suggests, "Try a wider date range or fewer filters." Check that the date in the box beside Date Range is the one you mean, and that you are in the right workspace. A saved report with no matches says "No rows match this report yet."
"This chart uses a field your role hides."#
The chart or number groups by or adds up a field your role can't see, such as a deal's value, so it is left out for you. A number says "This figure uses a field your role hides." On a dashboard, the widget says "Your role hides a field this widget is built on, so its figures are not shown to you." Ask an Owner or Admin about your role's field access.
"Your role can't export. Ask an admin for the export permission."#
Your role does not have the Export permission. An Owner or Admin can switch it on under Administration → Access → Roles and permissions. If the list's download button says "Nothing to export", the report has no matching records yet.
"Failed to run report"#
The report could not be read, followed by the reason. Click Retry. If a report says "This report has an invalid definition and cannot be run.", build it again with New report.
The scheduled email did not arrive#
Check the Time and the time zone the form shows. A schedule saved before 1 November 2026 keeps its hour in UTC until you edit it and click Update Schedule. For weekly emails, at least one day must be ticked ("Please select at least one day for weekly schedules."). If Schedule Report says "No reports available for scheduling.", create a report first.
The shared link says "This shared report has expired" or "Report not found or no longer available"#
The link was turned off, the report was deleted, or the link expired. Switch Public Access on again in Share and send the new link.
A dashboard says "Dashboard not found"#
"It may have been deleted, or it is not shared with you." Ask its owner to share it with your workspace or the whole team. If a change is refused with "Only the owner, or an admin for a shared dashboard, can change it.", make a private copy and change that instead.
Related Articles#
- Multi-Touch Attribution Reporting: see which channels bring in your deals.
- Customer Journey Mapping: follow the steps customers take before they buy.
- Document Tracking Analytics: see who opens your proposals and documents.
- User Roles & Permissions: give people the Export permission and set which fields a role can see.